In this post, I cover connecting Chrome Dev Tools wirelessly to a mobile device. Many other guides seem to require a USB cable first, but we’re going wireless first.
There are a number of reasons you may need to do this and cannot use a USB cable. In my case, the desktop machine I was using has some rather stringent restrictions on the USB port which could lock me out if it was concerned about the device. Connecting wirelessly was a far less risky option.
I knew Chrome remote debugging was an option, but had never tried it, even wired. If you can use USB, you are probably better doing so. Debugging over wireless is very slow.
Steps
This guide is was produced using an Ubuntu 24.04 desktop and an Android 15 mobile device. The desktop steps should work for any Linux or Mac version I believe, so long as they support adb. For Windows, you may need to replace ./adb with .\adb.exe. The Android steps may be different for other versions of the OS.
-
Download Android SDK platform tools
-
Enable developer mode on the mobile device:
-
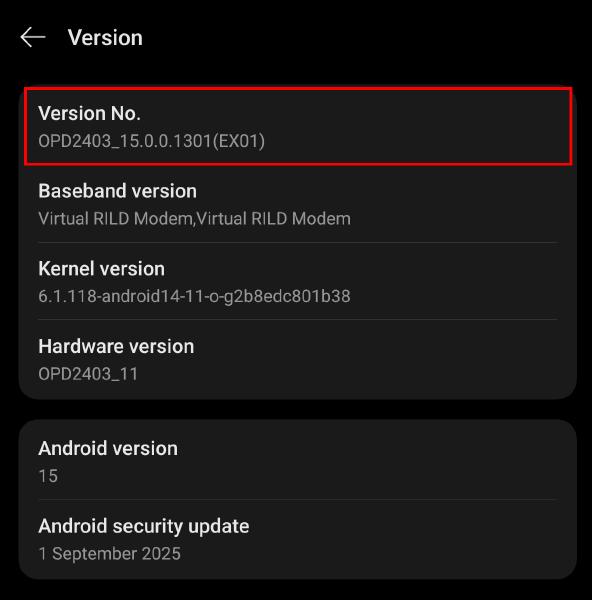
Go to settings and find the version number. On my device is was Settings > About Device > Version > Version No.
-
Press it a few times and you should start getting a toast message about developer mode. Keep pressing it until the toast says that developer mode is enabled.
-
-
Enable wireless debugging on the mobile device:
-
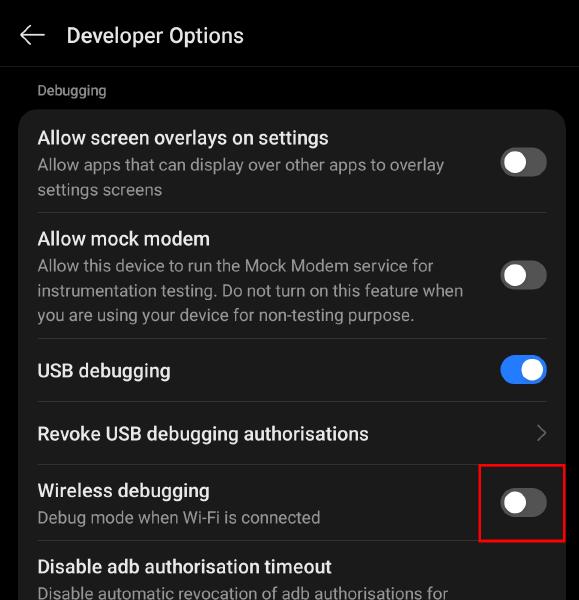
Go back to settings and find “Developer Options”. On my device it was Settings > System & Updates > Developer Options.
-
Find the option for “Wireless Debugging” and toggle the switch to on.
-
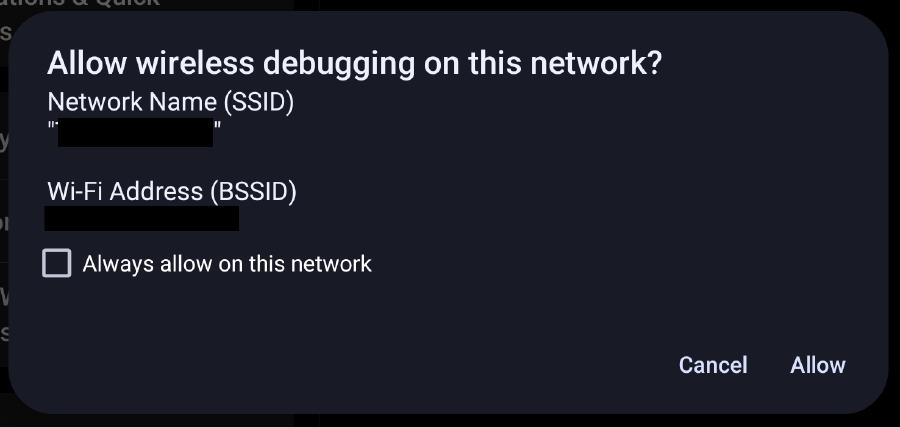
When prompted, press “Allow” to enable debugging on your current network. If you are on a trusted network, you can check the box to always allow.
-
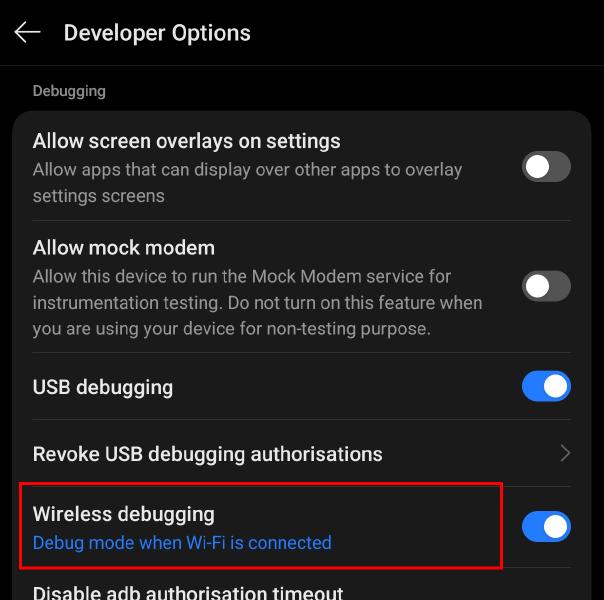
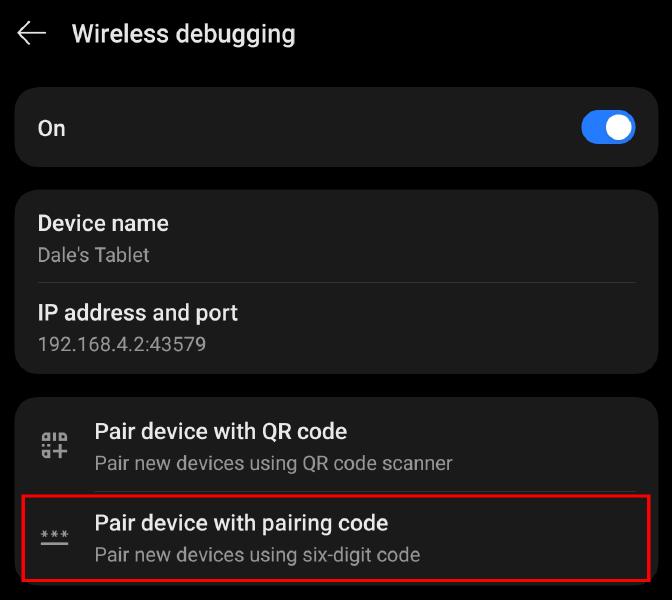
Tap the left side of the same “Wireless Debugging” item to open wireless debugging settings.
-
Set the mobile device aside for now.
-
-
Configure the wireless adb connection:
-
On your desktop, open a terminal and navigate to the directory containing the
adbexecutable. -
On the mobile device, select “Pair device with pairing code”.
A dialog with a pairing code and connection details should appear:
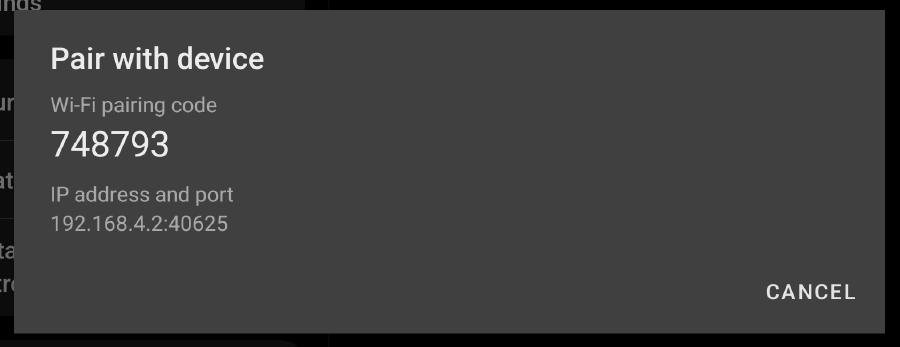
-
On your desktop, run the following command using the IP address and port from the previous step.
./adb pair <ip-address>:<port> -
When prompted, enter the code displayed on your device. You should get a success message.
~$ adb pair 192.168.4.2:40625 Enter pairing code: 123456 Successfully paired to 192.168.4.2:40625 -
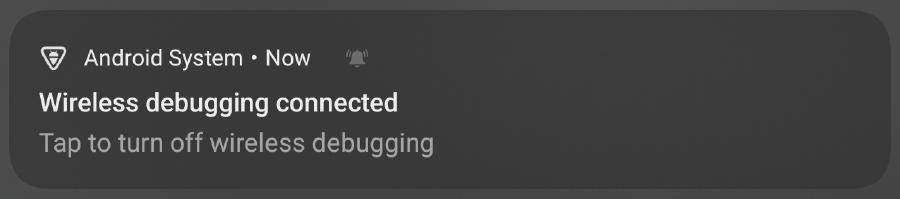
Next, run the following command.
The port should be the one on the “Wireless Debugging” settings page, NOT the port used for pairing.../adb connect <ip-address>:<port>You should get a notification on the mobile device that wireless debugging is now connected.
-
-
Connect chrome devtools:
-
Open chrome on both devices (you can also use chromium).
-
On your PC, navigate to
chrome://inspect/. You should see a list of all open tabs for the mobile device (it may take a few seconds to appear).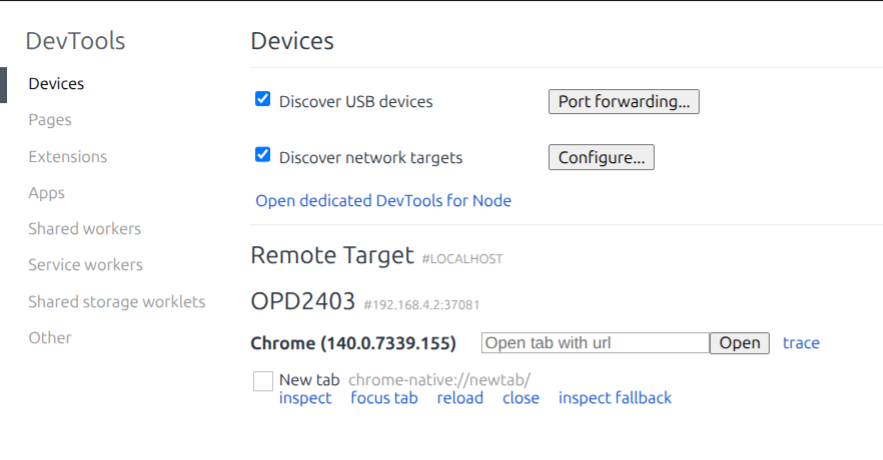
-
Click “Inspect” for the tab you want to debug
-


Result
You should now be able to debug any web page open on the mobile device. You can even interact with the preview to control the page on the device.

It should be noted that this will be much slower than debugging in a local browser. Ideally, you only use this for diagnostics. With modern responsive design, there should be very few issues specific to a mobile device. It is however very useful for finding the cause of an issue, so that it can be more easily reproduced on a desktop browser.